R - Strip Plots for all files in a directory
I often have directories full of text files (usually containing probe reports from SeqMonk). This little snippet will use R to create a strip plot with a column for each file.
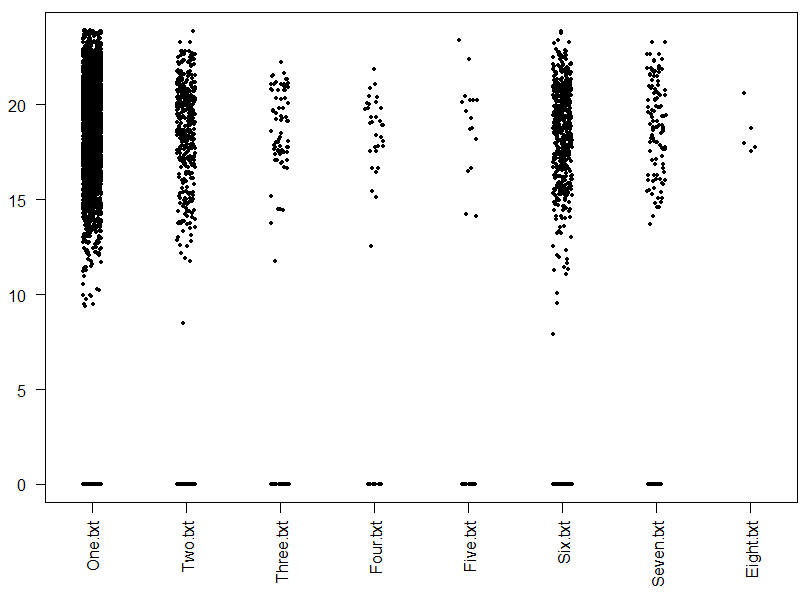
The files don’t have to be the same length and there can be any number of them. As the code stands it only reads in column 13 of the file (typically the column with the quantitated values in SeqMonk reports).
I hope this little snippet comes in handy for someone!
This file contains hidden or bidirectional Unicode text that may be interpreted or compiled differently than what appears below. To review, open the file in an editor that reveals hidden Unicode characters.
Learn more about bidirectional Unicode characters
setwd('C:/Your/Directory/Here') | |
files <- list.files(pattern="txt$") | |
i <- 0 | |
values <- list() | |
for(file in files) { | |
i <- i+1 | |
cc <- c(rep("NULL", 12), "numeric") | |
values[[i]] <- as.numeric(unlist(read.delim(file, colClasses = cc, skip=1, header = FALSE))) | |
} | |
names(values) <- files | |
par(mar=c(12,4,4,2)) | |
stripchart(values, vertical=TRUE, method="jitter", pch=20, cex=0.8, las=2) |
See the code in this GitHub Gist.